
Evaluating stock tool pricing means measuring a tool's cost against the specific workflow steps it removes friction from, not just comparing headline subscription fees. Most investors overpay because they focus on the monthly price instead of the plan limits that actually control what they can do. Tools like TradingView, Stock Rover, and Alpha Spread each structure their tiers around usage caps, data depth, and feature access. Understanding those constraints is the real method for assessing stock tool value. Get this right and you pay only for what your strategy actually needs.
How to evaluate stock tool pricing: the key factors
The effective price of any stock tool is determined by its plan limits, not the number on the checkout page. Alert caps, historical data depth, and export restrictions are the hidden multipliers that separate a cheap plan from a genuinely affordable one. A $13/month plan that blocks you from exporting data or running automated alerts may cost more in lost time than a $25/month plan that handles both.
Here are the core pricing factors you need to examine before committing to any tier:
- Alert caps. TradingView's Essential plan allows 20 alerts while Premium allows 400. If your strategy requires monitoring 50 or more setups simultaneously, Essential is functionally unusable regardless of its price.
- Historical data depth. TradingView ranges from 10,000 to 20,000 historical bars across tiers. Swing traders and backtesting users hit this ceiling fast on lower plans.
- API request limits. Alpaca's free plan caps WebSocket connections at 30 symbols and 200 historical API calls per minute. The paid plan at $99/month raises that to 10,000 API calls per minute. For custom-built screeners, that gap is enormous.
- Automation and webhooks. TradingView Plus unlocks webhooks and data export that Essential does not include. That single feature difference justifies the $12/month gap for any trader running automated alerts into a third-party system.
- Export restrictions. Cheaper plans often block CSV exports or limit chart downloads, forcing you to manually copy data or pay for a second tool.
Pro Tip: Before comparing prices, list every feature you use in a typical trading week. Then check whether each feature is available on the plan you are considering, not just the plan above it.
How to map your workflow to the right pricing plan

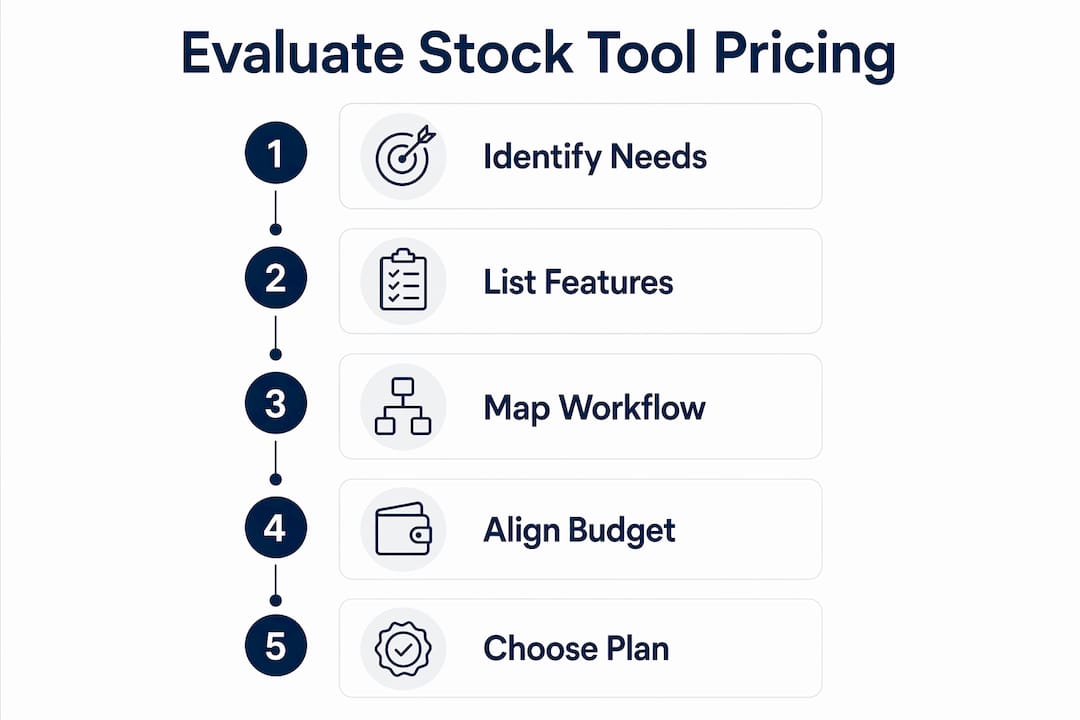
The most reliable stock tool pricing strategy starts with mapping your investment decision process before you open a single pricing page. Dividing your workflow into screening, charting, fundamentals analysis, and portfolio risk management reveals exactly which steps need premium features and which do not.
Follow this process to match your workflow to the right plan:
- Write down every step in your weekly process. Include stock screening, technical charting, reading earnings data, checking valuation metrics, and reviewing portfolio exposure. Be specific. "I screen 200 stocks every Monday" is more useful than "I do research."
- Identify your bottlenecks. Which steps take the most time or produce the most errors? If you manually track 40 alerts in a spreadsheet because your tool caps you at 20, that is a workflow bottleneck created by a pricing limit.
- Match each bottleneck to a feature. Slow screening points to filter count limits. Missed alerts point to alert caps. Inability to backtest points to historical data restrictions. Each bottleneck maps to a specific tier upgrade.
- Use free trials to stress-test the plan. Run your actual workflow, not a demo workflow, during the trial period. Most tools offer 14 to 30 days. Use that time to hit the limits deliberately so you know exactly where they fall.
- Compare the cost of upgrading versus the cost of the friction. If a $10/month upgrade saves you two hours of manual work per week, the math is straightforward. If the upgrade only adds features you will never use, stay on the lower tier.
This process works because tool value is defined by friction removal, not feature count. A tool with 50 features you never use is worth less than a tool with 5 features you use every day.
Comparing pricing tiers: TradingView, Stock Rover, Alpha Spread, and Alpaca
A direct stock analysis tools comparison reveals how differently platforms structure their pricing. The table below summarizes the key tier differences across four widely used tools.
| Tool | Entry Tier | Mid Tier | Top Tier | Key Pricing Driver |
|---|---|---|---|---|
| TradingView | Essential ~$13/mo | Plus ~$25/mo | Premium ~$60/mo | Alert count, webhooks, historical bars |
| Stock Rover | Essentials $7.99/mo | Premium $17.99/mo | Premium Plus $27.99/mo | Screening filters, data years, metrics count |
| Alpha Spread | Free (3 stocks/week) | $12/mo (15 stocks/week) | $20/mo (unlimited) | Valuation checks per week |
| Alpaca API | Free (30 symbols, 200 calls/min) | $99/mo | Custom | API call volume, symbol count |
TradingView tiers are driven primarily by alert count and automation access. The jump from Essential to Plus is justified almost entirely by webhooks and export capabilities, not charting quality. If you do not use automated alerts or external integrations, Essential handles most charting needs.
Stock Rover structures its tiers around screening depth and historical data. The Essentials plan provides 5 years of data and 275+ metrics. Premium Plus unlocks 700+ filters and full portfolio analytics. For fundamental investors running deep screens, the $27.99/month top tier is the only plan that covers the full workflow.
Alpha Spread uses a usage-cadence model. At $0/month for 3 stocks per week, $12/month for 15, and $20/month for unlimited, the right tier depends entirely on how often you run DCF or intrinsic value calculations. If you analyze 10 stocks per week, the $12 plan is the ceiling you need to hit.
Alpaca pricing is the most technical to model. One symbol equals one API request, so update frequency multiplies your usage fast. A trader pulling quotes on 100 symbols every minute burns through the free tier in seconds. Modeling your actual symbol count and update frequency before choosing a plan prevents a surprise bill.
Pro Tip: Calculate your Alpha Spread or Alpaca costs in "cost per symbol per update" rather than flat monthly rates. This gives you a real number that scales with your actual usage.
Common pitfalls when evaluating stock tool costs
Most pricing mistakes come from evaluating tools the way vendors want you to, by comparing headline prices and feature lists rather than actual usage limits. Here are the traps that cost investors real money:
- Ignoring alert caps until you hit them. Discovering your plan only supports 20 alerts after you have built a 50-alert monitoring system means an unplanned upgrade mid-month.
- Misreading API pricing as flat monthly fees. API costs scale with symbol count and update frequency. Treating API pricing as a flat rate causes budget overruns for traders with high-frequency data needs.
- Paying for features you use once a quarter. Advanced backtesting or portfolio risk tools sound valuable but add $10 to $20/month to your bill for features you might use four times a year.
- Overlooking data latency differences between tiers. Some platforms charge extra for real-time data versus 15-minute delayed feeds. If your strategy does not require real-time quotes, paying for them is waste.
- Skipping the vendor documentation. Free trial periods reveal usage limits in practice, but vendor docs reveal them in advance. Reading the plan constraints before trialing saves you from testing the wrong tier entirely.
"Tier differences like alert caps, webhook support, and historical bar counts can drastically alter whether you hit limits and need a more expensive plan." This is why evaluating stock tool costs requires reading the fine print on every constraint, not just the feature highlights.
Practical steps for forecasting your real stock tool costs
Forecasting your actual subscription cost requires more than reading a pricing page. It requires modeling your usage against plan limits before you commit.
- Count your weekly symbols and alerts. Track how many stocks you actively monitor and how many alert conditions you run in a typical week. This single number eliminates most wrong-tier decisions.
- Map each feature requirement to a specific plan limit. Use the vendor's feature comparison table and mark every limit that your workflow touches. If you need webhooks, mark the tier that includes them. If you need 10 years of historical data, mark the tier that provides it.
- Read the vendor documentation, not just the marketing page. Pricing pages highlight features. Documentation reveals limits. For API tools like Alpaca or data providers like MarketStack and Polygon.io, the docs contain the actual request caps and symbol limits that determine your real cost.
- Run the trial at full intensity. Do not use a free trial to browse features. Use it to replicate your busiest trading week. Hit the alert cap. Run the maximum number of screens. Export data. This stress-test tells you whether the plan holds up.
- Model your cost at 2x your current usage. If your strategy scales, your tool costs scale with it. A plan that fits today may not fit in six months. Factor in growth when comparing tiers, especially for API-based data tools where costs multiply with symbol count.
- Time your purchase around promotions. TradingView and Stock Rover both run annual billing discounts. Paying annually instead of monthly typically saves 20 to 40 percent. If you have confirmed the tool fits your workflow, annual billing is the most direct cost reduction available.
My honest read on stock tool pricing
I have spent years working through stock analysis tool pricing, and the single most consistent mistake I see is investors upgrading before they have confirmed the lower tier actually fails them. The instinct is to buy the plan with the most features because it feels like the safer choice. It is not. It is just the more expensive one.
Start free. Use the free tier until you hit a specific, recurring wall. That wall, whether it is an alert cap, a missing export, or a data depth limit, is the only valid reason to upgrade. Upgrading because a higher plan "sounds better" is how you end up paying $60/month for TradingView Premium when Plus at $25 covers everything your workflow actually needs.
The hidden multipliers that catch people off guard are export restrictions and API caps. Export limits sound minor until you realize you cannot pull your watchlist into a spreadsheet without manually copying 200 rows. API caps sound technical until your custom screener stops updating because you burned through your monthly request allowance on day three. Both of these are pricing tier details that live in the documentation, not the marketing page.
My recommendation: treat every stock tool evaluation as a workflow audit first and a price comparison second. The right plan is the cheapest one that removes your specific friction. Nothing more.
— Philip
See how Ai-stockscout fits your workflow and budget
You now know what to look for when comparing stock tool costs. Ai-stockscout is built for exactly this kind of value-conscious decision. It offers a generous free plan with real-time scanning, live alerts, insider and dark pool data, and social signals, plus a Pro upgrade that costs significantly less than most premium alternatives.
The 3-day Pro trial lets you stress-test the full feature set against your actual workflow before spending a dollar. No pressure. Easy cancellation. If Pro removes friction from your screening or alert workflow, you will know within three days. If it does not, the free plan still gives you more than most paid tools at zero cost. Try Ai-stockscout free and see where it fits.
FAQ
What does "evaluating stock tool costs" actually mean?
Evaluating stock tool costs means measuring a tool's subscription price against the specific plan limits and features your workflow requires, not just comparing monthly fees across platforms.
How do I know which pricing tier is right for me?
Count your weekly alert count, symbol monitoring needs, and data depth requirements, then match those numbers to the plan that covers them without excess. Use free trials to confirm the fit before paying.
Why do alert caps matter more than headline price?
Alert caps directly limit how many setups you can monitor simultaneously. A plan with a low alert cap forces manual monitoring or an unplanned upgrade, making the effective cost higher than the listed price.
How should I model API pricing for stock data tools?
Calculate API costs as cost per symbol per update rather than flat monthly fees. Multiply your symbol count by your update frequency to estimate real usage before choosing a plan.
Is a free trial enough to evaluate a stock tool?
A free trial is sufficient if you use it at full intensity. Replicate your busiest trading week, hit the alert cap, run maximum screens, and test exports. A passive trial that only browses features will not reveal where the plan limits fall.
Key takeaways
Matching stock tool pricing to your actual workflow limits is the only reliable method for avoiding overpayment and underperformance.
| Point | Details |
|---|---|
| Plan limits drive real cost | Alert caps, API request limits, and export restrictions determine effective price more than headline fees. |
| Workflow mapping comes first | Identify your screening, charting, and alert needs before comparing any pricing tiers. |
| Free trials require intensity | Stress-test trials at full usage volume to confirm where plan limits fall before committing. |
| API costs scale with usage | Model API pricing as cost per symbol per update to avoid unexpected bill increases as your strategy grows. |
| Upgrade only when friction appears | Start on the lowest viable plan and upgrade only when a specific, recurring workflow limit forces it. |