
Most investors are working with the same earnings reports, SEC filings, and price charts. That means they're seeing the same signals, at the same time, as everyone else. Alternative data sources for stocks change that equation. These are datasets sourced outside the company itself, including financial transactions, satellite imagery, web-scraped text, and public records, that give you a read on real-world activity before it shows up in official numbers. The investors and funds using this data aren't waiting for quarterly reports. They're already positioned.
Table of Contents
- Key takeaways
- 1. How to evaluate alternative data sources for stocks
- 2. Credit card and point-of-sale transaction data
- 3. Satellite imagery and geolocation data
- 4. Social media sentiment and web-scraped text data
- 5. Combining multiple sources with AI-driven analysis
- My honest take on alternative data investing
- See alternative data in action with Ai-stockscout
- FAQ
Key takeaways
| Point | Details |
|---|---|
| Traditional data has limits | Earnings reports and filings are backward-looking; alternative data gives you forward-looking signals. |
| Data quality matters more than quantity | Noisy, unverified datasets create false confidence and bad trades. Validate before you act. |
| Satellite and transaction data lead | These two categories offer the strongest real-world signals for stock research. |
| AI is the processing layer | Raw alternative data is useless without AI or NLP to clean, score, and structure it. |
| Retail investors can access this now | Affordable tools exist that bring alternative data within reach without a hedge fund budget. |
1. How to evaluate alternative data sources for stocks
Before you commit to any data source, you need a framework for assessing whether it's actually worth your time and money. Not all alternative data is created equal, and the wrong dataset can send you in completely the wrong direction.
Here's what to look at:
- Relevance: Does the data directly connect to the stocks or sectors you trade? Foot traffic data is gold for retail stocks and nearly useless for biotech.
- Timeliness: Is the data delivered in near real-time, or is there a lag that erases the edge? Fresh data wins.
- Coverage: Does it cover enough companies, geographies, or time periods to be statistically meaningful?
- Granularity: High-resolution data (daily, hourly, per-location) is more useful than broad aggregates.
- Compliance: Privacy and civil-liberty concerns around large transaction datasets are real and growing. Know what you're buying.
- Vendor credibility: Can the provider explain their sourcing methodology? If not, walk away.
Data quality is the most underrated factor. Biased samples, missing history, or inconsistent labeling will corrupt your analysis before you even run a model. And noisy datasets don't just fail to help. They actively mislead.
Pro Tip: Ask any data vendor for a sample dataset and a methodology document before signing a contract. If they can't produce both within 48 hours, that tells you something important about their operation.
2. Credit card and point-of-sale transaction data
Consumer spending data is one of the most direct signals available for stocks. When you can see how much people are actually spending at a retailer, restaurant chain, or subscription service, you don't need to wait for the earnings call to know how the quarter went.
Here's how it works in practice:
- Aggregated, anonymized credit card and debit card transactions are pooled from card networks and financial institutions
- Data providers normalize and map spending to specific merchants or categories
- Analysts compare spending trends week over week or year over year to infer revenue performance
- Signals are used to model earnings surprises before official reports drop
The practical application is powerful. If you see a 12% spike in spending at a major home improvement chain heading into the final weeks of a quarter, that's a data point the market hasn't priced in yet. Retail earnings forecasting is the most common use case, but the same logic applies to travel, food service, and subscription businesses.
There are real limitations to know about. Transaction data tends to lag in highly fragmented markets where no single card network has full coverage. It also reflects consumer behavior, not business-to-business revenue, so it's less useful for industrial or enterprise software companies.
Alternative datasets) like transaction records often cannot be handled by traditional spreadsheet tools. You need structured pipelines to make them useful.
3. Satellite imagery and geolocation data
This is where alternative data gets genuinely interesting. Satellite imagery gives you a view of the physical world that no earnings report can replicate. You can count cars in a retailer's parking lot, track oil tanker movements, monitor construction progress at a new facility, or watch crop conditions in real time.
| Data Type | What It Measures | Stock Use Case |
|---|---|---|
| Nightlight intensity | Economic activity by region | GDP nowcasting, emerging market exposure |
| Parking lot occupancy | Retail foot traffic | Earnings preview for big-box retailers |
| Shipping vessel tracking | Global trade volume | Supply chain and commodity plays |
| Infrastructure changes | Construction and expansion | Capital expenditure signals for industrials |
| Agricultural imagery | Crop health and yield | Commodity price forecasting |
The macro applications are just as compelling as the company-level ones. An IMF working paper published in 2026 showed that machine learning combined with satellite nightlight data significantly improves GDP nowcasting accuracy compared to traditional indicators alone. That matters for macro investors positioning around economic cycles.
At the micro level, a PLOS ONE study demonstrated that high-resolution satellite images combined with census data can estimate per-capita income at a 50x50 meter resolution with an R² of 0.878. That level of spatial precision opens up entirely new ways to assess local economic conditions relevant to regional banks, real estate, and retail.
Pro Tip: Satellite data is powerful but expensive to process. Start with providers that offer pre-processed, company-mapped outputs rather than raw imagery. You'll save weeks of engineering time and get to the signal faster.
The challenges are real. Raw imagery requires significant processing power and specialized models to extract usable signals. Practitioners mitigate model risks through rigorous tail-stress testing and careful calibration, especially when extrapolating beyond training data boundaries.
4. Social media sentiment and web-scraped text data
Text is everywhere, and a lot of it moves markets. Social media posts, product reviews, earnings call transcripts, analyst commentary, and forum discussions all contain signals about sentiment, momentum, and risk that traditional data completely ignores.
The most useful sources for market sentiment analysis include:
- Social platforms: Real-time discussion on financial forums captures retail investor sentiment and can flag unusual activity in specific tickers before price moves
- Earnings call transcripts: Management tone, word choice, and hesitation patterns often reveal more than the numbers themselves
- Product reviews: Aggregated review sentiment for consumer companies predicts brand health and future revenue trends
- News and regulatory filings: Web-scraped text from press releases and government databases surfaces events before they're widely reported
The extraction process relies on natural language processing and sentiment scoring. An AI model reads thousands of posts or documents, assigns sentiment scores, and flags significant shifts. When sentiment on a stock moves sharply negative across multiple sources simultaneously, that's worth paying attention to.
For earnings call data specifically, Quartr's API offers near-zero latency streaming of live transcripts with over 95% transcription accuracy. That kind of real-time text feed lets you run sentiment models on management commentary the moment the words are spoken, not hours later.
The reliability problem is real. Social media is noisy, manipulated, and full of coordinated pump activity. You need sophisticated filtering to separate genuine sentiment from artificial signals. Raw social data without AI processing is more likely to mislead you than help you.
5. Combining multiple sources with AI-driven analysis
No single alternative dataset tells the whole story. The real edge comes from combining multiple sources into a structured, scored signal that you can act on. This is where AI and integrated data platforms become the difference between information and insight.
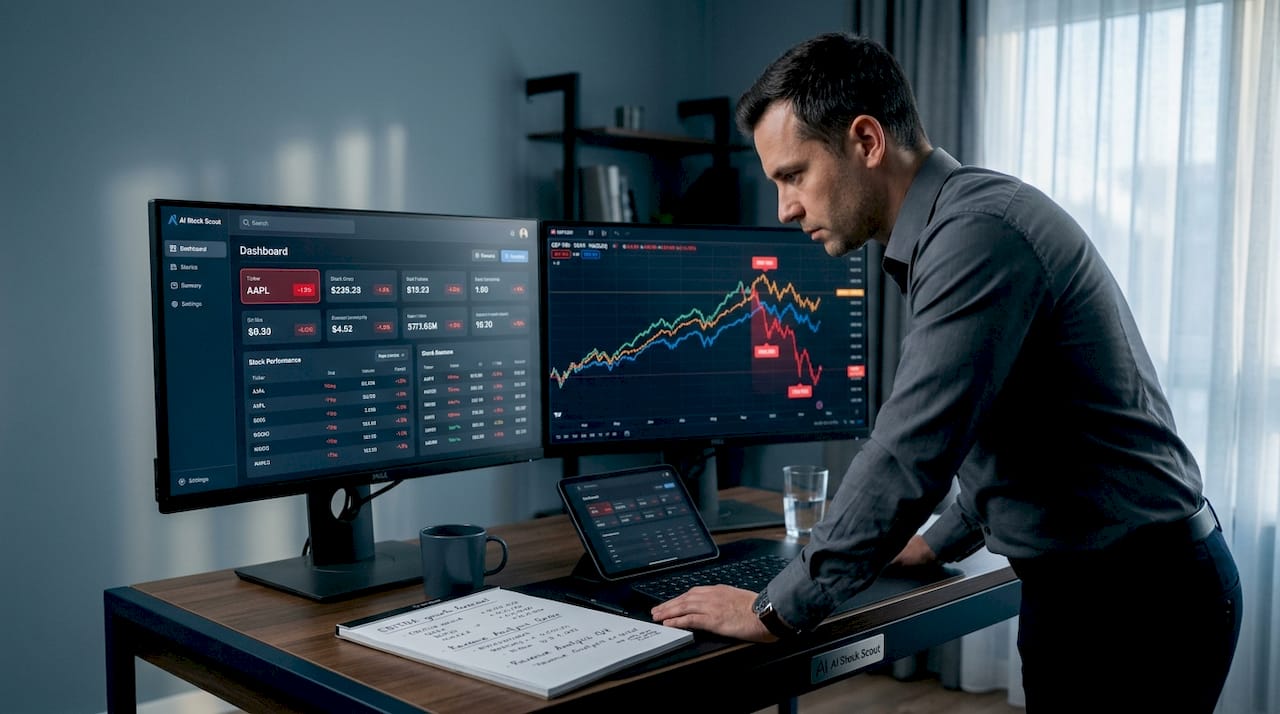
Hedge funds spent $2.8 billion on alternative data in 2025, a 17% increase from the prior year, driven largely by AI making it faster and cheaper to process diverse datasets into usable research. The same AI infrastructure that was once exclusive to institutional players is now accessible to retail investors through affordable tools.
A practical alternative data stack for a retail investor might look like this:
| Layer | Data Type | Purpose |
|---|---|---|
| Signal layer | Transaction data, satellite imagery | Real-world activity monitoring |
| Sentiment layer | Social media, transcripts, reviews | Market mood and narrative tracking |
| Structural layer | Insider trades, dark pool activity | Institutional positioning signals |
| Output layer | AI-scored alerts and ranked signals | Prioritized trade ideas |
Projects like the Investment Alternative Data MCP show how diverse datasets including filings, consumer sentiment, and patent data can be integrated into machine-readable, scored outputs for investment research. That's the architecture serious investors are building toward.
The risk in multi-source integration is false confidence. More data doesn't automatically mean better decisions. Grounding AI outputs against trusted sources using evaluation probes is critical for avoiding misleading conclusions. NIST research makes clear that robust AI workflows must separate retrieval from verification. A fluent AI-generated narrative is not the same as a verified investment signal.
The practical takeaway: use AI to clean, normalize, and score your data. But always maintain an audit trail and validate outputs against known facts before acting. Success in this space depends more on data cleaning and AI-assisted processing than on raw data acquisition alone.
My honest take on alternative data investing
I've watched a lot of investors get excited about alternative data and then get burned, not because the data was bad, but because they skipped the boring parts. The cleaning. The validation. The governance.
The most common mistake I see is treating an AI-generated summary of alternative data as a verified fact. It isn't. AI-synthesized insights need to be grounded against authoritative sources before you act on them. That extra step is what separates a real edge from a confident mistake.
My other observation: individual investors consistently underestimate how much value comes from just two or three well-chosen data sources used consistently, versus trying to integrate ten sources poorly. Pick transaction data or social sentiment. Learn it deeply. Build your process around it. Then add a second layer.
The regulatory environment is also shifting fast. Privacy concerns around transaction datasets are influencing what data can be collected and how it's stored. That's not a reason to avoid alternative data. It's a reason to work with vendors who take compliance seriously.
The opportunity is real. But discipline beats enthusiasm every time in this space.
— Philip
See alternative data in action with Ai-stockscout
You don't need a hedge fund budget to use alternative data. Ai-stockscout puts it directly in your hands.
Ai-stockscout combines insider trading signals, dark pool activity, congressional trades, and social sentiment into one clean, real-time dashboard built for retail investors and active traders. No data science degree required. No expensive subscriptions. The free plan gives you immediate access, and the Pro upgrade costs a fraction of what institutional tools charge. You can scan smarter with AI and start spotting moves the market hasn't priced in yet. Try Pro free for 3 days, cancel anytime. If you want to go deeper on how to pair these tools with your existing workflow, the guide on how to use a stock scanner effectively is worth your time.
FAQ
What are alternative data sources for stocks?
Alternative data sources for stocks are datasets collected outside traditional financial filings, including credit card transactions, satellite imagery, social media sentiment, and web-scraped text. They give investors signals about real-world company and economic activity before it appears in official reports.
Is alternative data legal to use for investing?
Yes, using alternative data for investing is legal as long as the data is sourced ethically and complies with privacy regulations. Investors should verify that their data vendors follow applicable laws around data collection and storage.
How do retail investors access alternative data?
Retail investors can access alternative data through affordable platforms that aggregate and pre-process signals like insider trades, dark pool flows, and social sentiment into usable dashboards, without needing to build their own data pipelines.
How accurate is social media sentiment for stock signals?
Social media sentiment can be a useful leading indicator, but raw data is noisy and prone to manipulation. Accuracy improves significantly when natural language processing filters are applied to separate genuine sentiment from coordinated activity.
Why do hedge funds spend so much on alternative data?
Hedge funds spent $2.8 billion on alternative data in 2025 because AI has made it faster to process diverse datasets into structured research, giving funds a measurable edge in identifying opportunities before they're widely recognized.