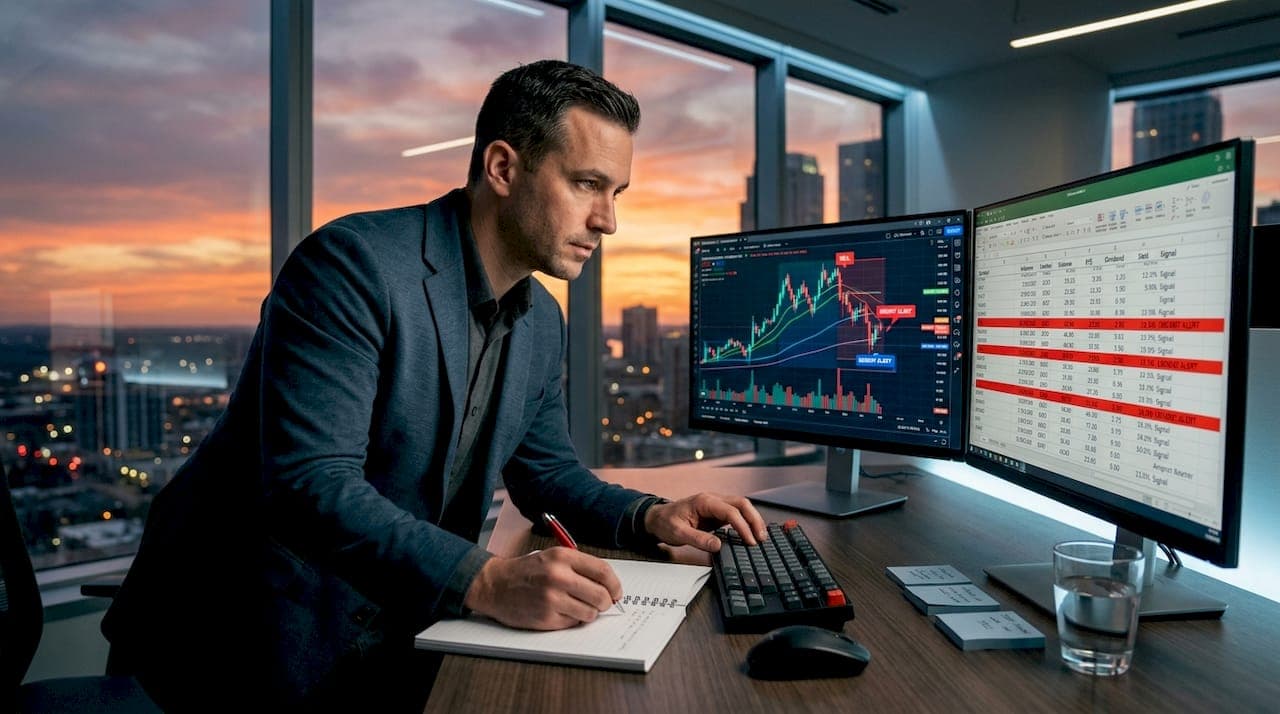
Most traders assume AI in stock analysis just runs faster versions of the same math humans use. That assumption is wrong. Modern AI doesn't simply scan spreadsheets or crunch price averages. It sees charts. The most powerful systems today treat candlestick charts as images, letting neural networks recognize visual patterns the way a trained eye would but across thousands of stocks simultaneously and without fatigue. Understanding how AI analyzes stock patterns gives you a real edge. Not just in knowing when to trust an AI signal, but in knowing exactly why it fired.
Table of Contents
- Key takeaways
- How AI analyzes stock patterns using visual recognition
- Seeing the AI's reasoning with Grad-CAM
- Market regimes and graph neural networks
- From AI output to real trade decisions
- Using AI pattern analysis in your actual strategy
- My take on AI, patterns, and what traders actually need
- See AI pattern analysis in action with Ai-stockscout
- FAQ
Key takeaways
| Point | Details |
|---|---|
| AI sees charts visually | Convolutional neural networks convert OHLCV data into images to detect patterns like head and shoulders or double tops. |
| Explainability matters | Grad-CAM heatmaps show which chart regions drove an AI prediction, helping traders verify and trust signals. |
| Regime awareness improves accuracy | HMM-based models detect bull, bear, or sideways markets so AI adapts its pattern interpretation accordingly. |
| Thresholds create clear signals | Ensemble AI outputs only become reliable trade signals when paired with deterministic BUY/HOLD/SELL thresholds. |
| AI supports, not replaces, judgment | The best AI tools work as decision-support layers that you verify and combine with your own analysis. |
How AI analyzes stock patterns using visual recognition
The foundational method behind modern machine learning stock patterns is surprisingly visual. Rather than feeding raw price data as a table of numbers, many AI systems convert price history into images first.
Here's how it works step by step:
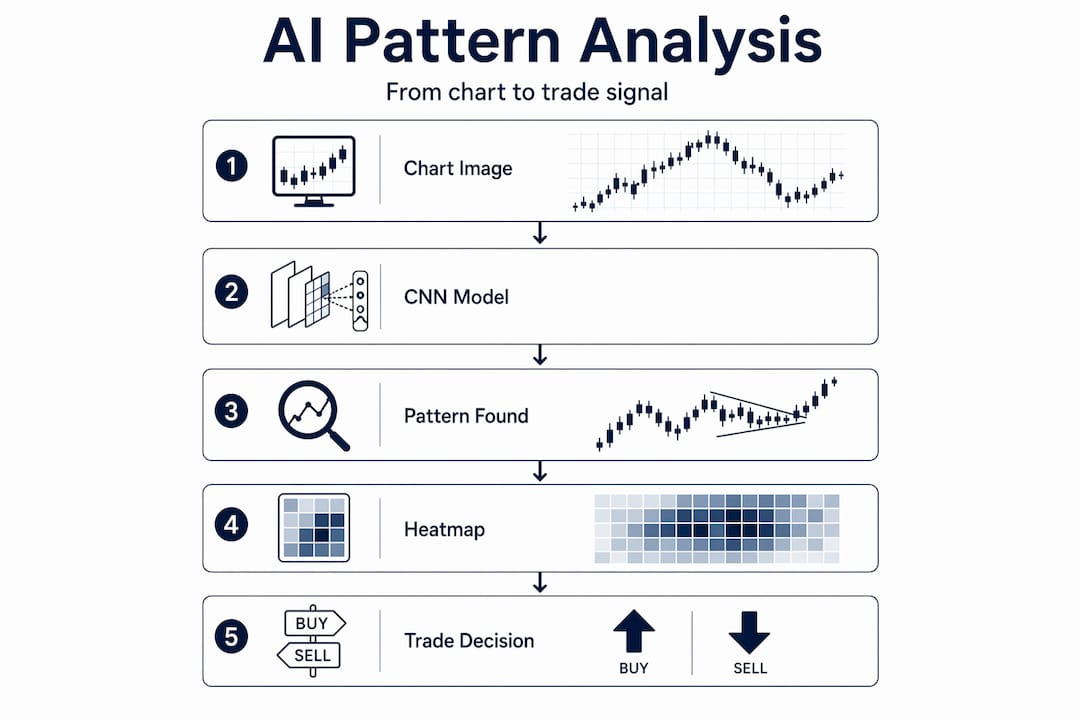
- Capture a data window. A 60 to 100 bar window of OHLCV data (open, high, low, close, volume) is selected for each stock.
- Render it as a chart image. That window becomes a candlestick chart image, typically 128x128 pixels. Each candle's body, wicks, and relative position become spatial features the AI can process.
- Feed it into a convolutional neural network (CNN). CNNs are the same architecture used in facial recognition software. Convolutional filters scan the image for edges, curves, and shapes. Deeper layers combine those raw features into complex patterns.
- Match to known patterns. After training on thousands of labeled examples, the CNN learns to recognize formations like head and shoulders, double tops, ascending triangles, and bull flags.
- Output a confidence score. The model doesn't just say "pattern detected." It outputs a probability, such as 87% likelihood of a bearish reversal pattern.
The accuracy here is real. CNN and Capsule network models reach around 84% classification accuracy on candlestick patterns with F1 scores above 78%. That's genuinely competitive with experienced human technical analysts, and it scales to thousands of tickers at once.
Training these models requires careful data labeling. Heuristic methods use rule-based logic to auto-label historical patterns, while manual labeling is slower but cleaner. Either way, avoiding label leakage during train/test splitting is critical. If the model accidentally trains on future data, accuracy numbers look great but real-world performance collapses.
Pro Tip: When evaluating any AI trading tool that claims pattern recognition, ask whether confidence scores are calibrated. A model that says "90% confident" on every trade is not useful. Look for tools that show a distribution of scores and let you set your own threshold.
Seeing the AI's reasoning with Grad-CAM
Knowing that an AI spotted a pattern isn't enough. You need to know what part of the chart it's actually looking at. That's where Grad-CAM (Gradient-weighted Class Activation Mapping) changes the game.
Here's the process in plain terms:
- The CNN processes a chart image and makes a prediction
- Grad-CAM runs a backward pass through the network to measure which spatial regions had the most influence on that prediction
- Those regions are highlighted in a heatmap and overlaid on the original chart image
- Bright areas in the heatmap show where the AI's "attention" was concentrated
The result is a visual explanation you can actually look at. If the model flags a bearish reversal pattern and the heatmap lights up around the right shoulder and neckline of a head and shoulders formation, you know the AI is reading the chart the way it should. If the heatmap highlights irrelevant areas like flat consolidation on the left edge, that's a red flag worth investigating.
Grad-CAM heatmaps are generated through a forward and backward pass on the CNN, producing upsampled overlays that map directly onto the chart image. This is not an approximation. It shows the actual gradient signals from inside the model.
Understanding what features AI models focus on is not optional. It's what separates a tool you can trust from one that produces random noise with a slick interface.
That said, heatmaps alone have limits. Grad-CAM visuals combined with local explanations and decision audits give traders much better insight than heatmaps in isolation. Think of Grad-CAM as a starting point for verifying AI logic, not the final word.
Limited adoption of deep learning in trading has historically been driven by poor interpretability and unreliable confidence estimation. CNN models paired with Grad-CAM directly address this by making decisions auditable and more compliant with risk management standards.
Pro Tip: If you're using an AI stock scanning tool, check whether it provides any explanation of why a pattern was flagged. Tools that offer visual or textual reasoning are significantly more useful for building a real strategy versus black-box score outputs.
Market regimes and graph neural networks
One of the most overlooked dimensions in how AI predicts stock trends is market regime detection. A bullish reversal pattern in a strong uptrend means something very different than the same pattern in a confirmed bear market. AI that ignores this distinction makes avoidable errors.
Here's how the two dominant approaches compare:
| Method | What it does | Strength | Limitation |
|---|---|---|---|
| Hidden Markov Model (HMM) | Assigns probability scores to market states (bull, bear, choppy) | Interpretable, works well on daily data | Assumes fixed number of regimes |
| Graph Neural Network (GNN) | Models dynamic relationships between stocks in a network | Captures cross-asset correlations | Computationally intensive, harder to interpret |
HMM-based regime detection works by assigning posterior probabilities to daily market states. For example, a trading day might be classified as 70% bull and 30% choppy. Rather than hard switching between strategies, well-built systems blend strategy allocations according to those probabilities. This soft weighting makes the system more stable near regime transitions, which is exactly when rigid rule-based models tend to fail.
Graph neural networks go a step further by capturing dynamic relationships between stocks. Stocks in the same sector tend to move together, but those correlations shift over time. GNNs learn these evolving dependencies and incorporate them into forecasting. Regime-aware models that fuse HMM detection with dynamic GNN graphs achieve forecasting errors as low as MAPE 1.884% on major indexes, significantly outperforming static models.

Market patterns behave differently depending on the prevailing regime. AI that adapts to that reality is a fundamentally better forecasting tool than AI that treats all market conditions the same.
From AI output to real trade decisions
Raw model outputs, like a 63% probability score on a bullish signal, are not trade signals. They're inputs. The step that makes AI trading algorithms actually usable in live markets is deterministic decision thresholding.
Here's what that looks like in practice:
- A BUY signal triggers when the combined model score reaches 70% or above
- A HOLD signal triggers when the score falls between 40% and 69%
- A SELL signal triggers when the score drops below 40%
Ensemble AI models combine outputs from multiple model types (CNN, HMM, GNN) before applying these thresholds, which smooths out the noise from any single model's errors. The ensemble score is more stable and more reliable than any individual model's raw output.
Separating ML scoring from deterministic thresholds is what prevents AI systems from generating inconsistent or contradictory signals. Without this separation, small fluctuations in model confidence can flip a signal from BUY to SELL between refreshes, which is operationally useless.
The best systems also attach plain-language explanations to each signal, generated from the combination of heatmap data, regime context, and threshold logic. This gives you the signal, the reasoning, and the market context in one place. Trading AI systems require deterministic decision layers to produce signals you can actually act on with consistency.
Using AI pattern analysis in your actual strategy
Understanding the mechanics is one thing. Applying it to your real trading decisions is another. Here's how to do that effectively:
- Use AI scanning to filter, not decide. Let AI pattern recognition narrow thousands of tickers down to a short watchlist based on high-confidence signals. You do the final analysis on that smaller set.
- Check the confidence score distribution. A signal at 82% confidence with a regime classification of "strong bull" carries far more weight than a 51% signal in a choppy market. Treat scores as context, not commands.
- Review heatmap explanations before acting. If a stock scanner tool provides visual explanations, spend 30 seconds checking that the AI focused on the right chart region. Anomalies in heatmap focus are early warnings of a bad signal.
- Combine AI output with your existing indicators. AI pattern recognition works best alongside volume analysis, support and resistance levels, and sector momentum. No single signal type wins in isolation.
- Track your AI-assisted trades separately. Keep a record of which trades were flagged by AI and what the confidence score was. Over time, you'll learn exactly which score ranges and regime conditions produce the best outcomes for your style.
Pro Tip: The traders who get the most out of AI tools are not the ones who automate everything. They're the ones who use AI to handle the scanning workload and save their own judgment for the final call. That combination consistently outperforms either approach alone.
One common mistake is abandoning AI tools after a few wrong signals. Trader-facing CNN models show modest accuracy metrics in isolation, but their real value is in auditability and decision support. A tool that explains itself badly, not one that is occasionally wrong, should be replaced.
My take on AI, patterns, and what traders actually need
I've spent a lot of time looking at how AI in stock analysis gets sold to retail traders versus how it actually performs. The honest version is more nuanced than most tools admit.
Pure predictive accuracy is the wrong metric to optimize for. A model that is right 55% of the time with clear explanations and regime awareness will outperform a 70% accurate black box in real trading conditions. Why? Because the 55% model tells you when it's uncertain. The black box doesn't.
What I've found genuinely useful is regime-aware pattern recognition. When the market shifts from trending to choppy, most pattern-based strategies fall apart. Models that incorporate regime probabilities adapt. They don't just give you a different signal. They give you appropriate confidence for the current conditions.
The mistake I see traders make most often is treating AI signals as complete analysis. They're not. They're structured starting points. The explainability layer, whether that's a heatmap or a plain-language reason, is what turns a signal into understanding. Understanding is what you can actually trade on.
AI will keep improving. But the traders who will benefit most are those who learn to read AI output intelligently, not just act on it blindly.
— Philip
See AI pattern analysis in action with Ai-stockscout
You now know the mechanics behind how AI reads charts, detects regimes, and generates signals. The next step is having access to tools that actually do this work for you, without the six-figure platform price tag.
Ai-stockscout brings CNN-powered pattern scanning, real-time alerts, and alternative data (insider activity, dark pools, congressional trades, social sentiment) into one affordable platform. You get professional-grade AI analysis built for retail investors and active traders. The free plan is genuinely useful. The Pro upgrade costs a fraction of what comparable platforms charge, and you can try it free for 3 days with easy cancellation. No pressure. Just real tools that help you spot opportunities faster and make decisions with more confidence. Start your free trial today and see what you've been missing.
FAQ
How does AI detect stock chart patterns?
AI converts OHLCV price windows into chart images and uses convolutional neural networks to detect visual patterns like head and shoulders or double tops. The CNN learns to recognize spatial features in the same way image recognition software identifies faces.
Can AI analyze market data accurately enough to trade on?
Yes, with the right setup. CNN models combined with Grad-CAM explainability reach around 84% pattern classification accuracy, but accuracy alone is not enough. Reliable signals also require regime detection and deterministic decision thresholds.
What is a market regime and why does it matter for AI?
A market regime is the prevailing condition of a market, whether it's trending bullishly, declining, or moving sideways. AI models that detect regime shifts produce significantly more reliable pattern signals because the same pattern can signal different outcomes in different conditions.
What is Grad-CAM and how does it help traders?
Grad-CAM is a technique that generates heatmap overlays on chart images showing which regions most influenced an AI prediction. It helps traders verify that the AI is reading relevant chart features rather than reacting to noise.
How do AI trading algorithms turn model scores into real signals?
Ensemble models combine outputs from multiple AI sources, then apply fixed thresholds to generate clear BUY, HOLD, or SELL signals. For example, a score above 70% triggers a BUY and a score below 40% triggers a SELL, removing ambiguity from raw probability outputs.